
Perhaps this is partly due to an absence of suitable alternatives which are both readily computable and readily interpreted, whilst also capturing the core objective of mitigating potential losses.
For trading organisations looking to implement VaR, one of the primary challenges is that of calibration: namely how to describe or specify the distribution of possible market outcomes that might potentially occur tomorrow. Regardless of the composition of the portfolio, or how valuable or risky this is, the calibration is key to the VaR output: a narrow distribution of market outcomes will lead to a narrow distribution of P&L values, and vice versa.
Within the commodities sector, the simplest such approaches are based upon history: look at the market movements that have occurred in the recent past, and argue that it’s reasonable these may occur again in the near future, with similar frequencies. Looking at movements that have already been observed to happen removes an element of subjectivity; one is no longer speculating wildly about hypothetical outcomes without any basis on reality.
The question then is, how much history should we look at – one month, one year, five years? Too short a history, and the small sample size doesn’t capture the full range of possibilities that might occur, or even that already have occurred, in much the same way that the last few rolls of a die would not capture the six possible outcomes of its next roll with their equal probabilities. We may miss the likelihood of more extreme events which occur only rarely and thus have not done so for some time. Conversely, too long a history, and we place too much dependency on the distant past which may be of limited relevance, much as the weather on a single day last month is a poorer indicator than yesterday’s weather might be, of what might happen tomorrow. We risk distorting our analysis by taking account of past events with little bearing on today, since which time the market regime or fundamentals may well have evolved.
There’s also the problem of having an abrupt end to the historical observation window. A single outlier observation will remain part of a calibration window for a limited period of time, initially contributing to a wide distribution of future market outcomes. Then one day it will suddenly drop out of the sample period, leading to a significant narrowing of the market distribution and an associated sharp drop in VaR. Such instability in risk metrics is never helpful for effective risk management; ideally all metrics should evolve continuously, perhaps quickly or slowly, but without instantaneous changes that aren’t caused by a new environmental influence or regime shift. The portfolio is not significantly less risky today than it was yesterday (and is perhaps only marginally so), just because the observed outlier has moved one day further away in the rear-view mirror.
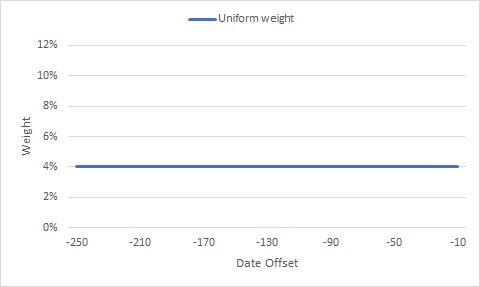
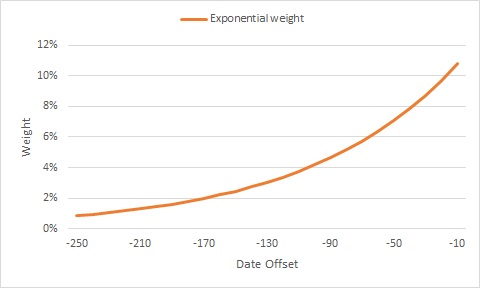
One approach to resolving this matter is an exponentially weighted historical distribution. Rather than a fixed historical observation window, with all encompassed dates treated equally, individual dates are assigned different “weights” or importance levels within the sample. Moving forward in time towards the current date, each date is given successively more weight, using a constant ratio of weights between successive dates.
Working backwards from the current date, a specific implementation might assign each date e.g. 2% less weight than the date it precedes. By the time we reach 250 days ago (roughly one year in business days), the weight of a single date has decayed to 1/150th of the most recent date, and any dates further back than this can be omitted from the sample altogether. The consequence is that any new market observation will have an immediately strong impact on the VaR, with the magnitude of this impact slowly decaying as the observation recedes into the distance, eventually becoming negligible. This is in line with the heuristic that one looks for, when asking whether history is an appropriate indicator of the future.
The magic numbers 2% and 250 in the example above are somewhat arbitrary, and the practitioner is free to choose other values that suit their application. The other magic number, 1/150th, is driven by these first two – other choices of parameters would produce different ratios of importance between the nearest-most and furthest-most dates. Picking the “correct” parameters is more of an art than a science, and different combinations are inevitably more suited to different markets and different risk-management exercises.
In conclusion, for a sensible enough choice, this methodology allows the computation of a VaR metric based on a historic calibration, which is neither too long nor too short in the time domain, and which also remains stable in the absence of regime shifts.
Despite its well-documented limitations and weaknesses, value-at-risk (VAR) remains a core risk metric which is heavily relied upon by financial trading institutions


%20(2).jpg)